

Half a million tests can map an opportunity or manufacture a winner; the difference is how the outputs are used. Then the coin toss every ranking has to beat.
Welcome back to the series on building rotational momentum strategies.
Earlier I called broad reconnaissance the opposite of overfitting. That shorthand needs a qualification: not taking the best row does not remove selection bias. Choosing a universe, factor family or research direction after reading the grid also uses the history. A large grid can reveal consistent effects that a single backtest hides; it can also provide thousands of ways to rationalise a preference.
This post is about two things that belong together: how to read a very large grid without fooling yourself, and the test every later claim had to clear. I took the momentum score out of the model, put a random number in its place, and compared. That second one changed the shape of the project.

The Machine
There is honestly only so much data one can throw a momentum idea at. The Nasdaq is the poster child, with its limited history, limited number of regimes, limited number of stocks, limited sectors. Literally anything I do with that is going to be over-fit. My own solution was to manufacture far, far more data, by looking not just at 20 different universes, but thousands of possible pathways through those universes, created by imagining different pathways random models could weave through time. I don’t want to leave any scope for over-fitting. Something needs to either ‘show itself’ amidst all of that, or I bin the whole project. I see this as the opposite of over-fitting, so don’t read ‘half a million backtests’ the wrong way - you’d be very much mis-understanding what I meant by ‘backtest’.
These are not backtests of a model, these are data simulations that I’m using to try and answer research questions. Hopefully the distinction becomes clearer through the series if it isn’t right now.
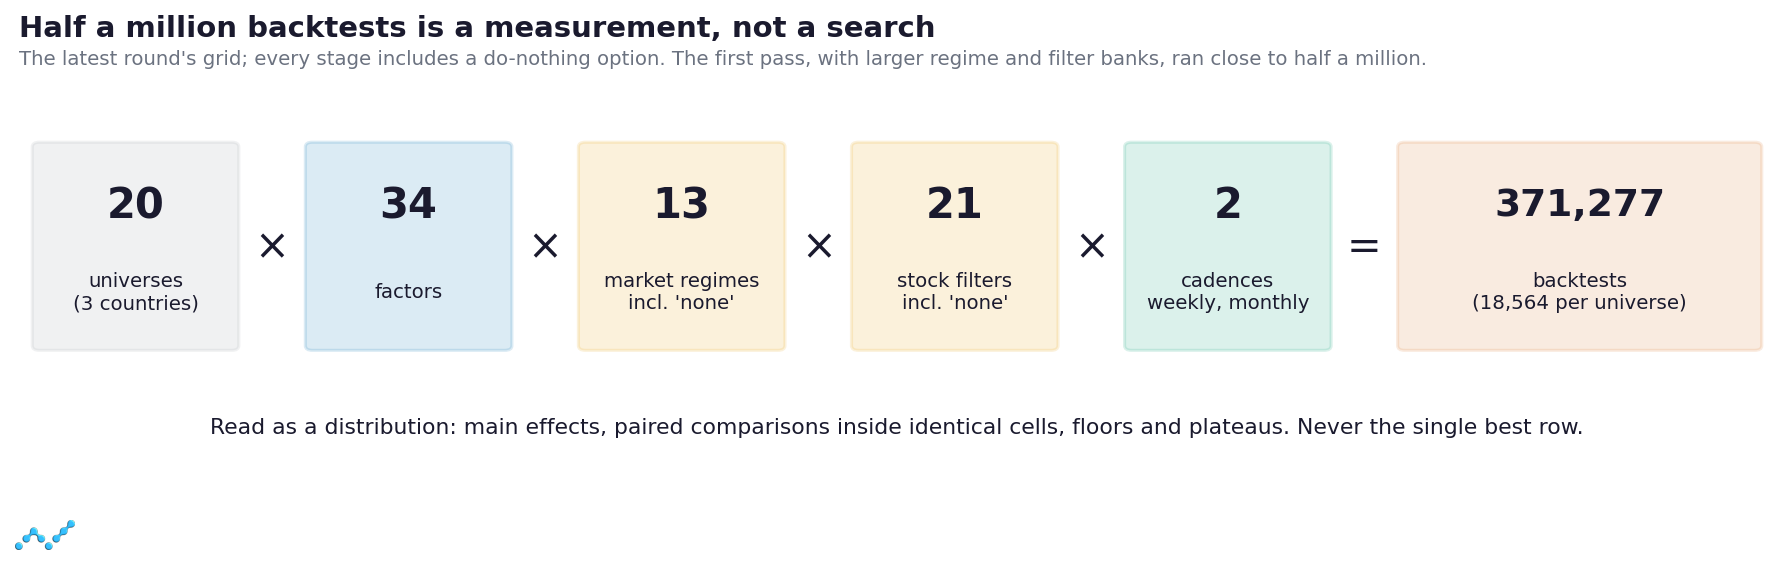
The research file is a pipeline with one selector per stage, and every stage has a do-nothing option so there’s always a control:
Universe: 20 of them, across the US, Canada and Australia, from the Nasdaq-100 down to small caps.
Factor: 34 ways of measuring momentum.
Market regime: 13 options in this run, index-level filters of a few kinds (trend, absolute momentum, channels, near-the-high), etc.
Stock filter (gate): 21 options, per-stock filters of a few kinds (own trend, proximity to highs, buy-the-dip, volatility relative to the stock’s own history, etc).
Cadence: weekly or monthly rotation.
Hold five names, equal weight, rotate on the rebalance day, sell when a holding drops out of the top eight or leaves the index. It’s a research artefact at this point, not a model. (Remember previously we tested the top 5, the next 5, and so on, all the way down).
In the first pass, on larger regime and filter banks, that grid came to close to half a million backtests. In the latest round it was 34 factors × 13 regimes × 21 gates × 2 cadences: 18,564 configurations per universe and 371,277 simulations across the 20 universes, then several thousand targeted tests and nearly ten thousand for the coin toss below.
Searching vs Measuring
Here’s the distinction everything else rests on.
Searching asks: which configuration did best? You sort by a metric, take the top row and call it your model. With 18,564 rows per universe, the top row is guaranteed to look wonderful, and most of what makes it wonderful is noise that happened to line up with your lucky parameter selection.
Measuring asks: what’s the shape of the whole space? Which components move results in a consistent direction wherever you put them? Which ones only shine in a few lucky cells?
To measure rather than search, I read the grid five ways.
Main effects. Average each component’s effect over everything else. A factor that only works over a single path (e.g. with one regime and one filter) isn’t a factor result, it’s a cell result. Meaningless.
Paired comparisons. Compare two factors inside identical scaffolding: same universe, regime, filter and cadence. Count how often one beats the other. This strips out everything that isn’t the factor.
The floor. For each component, look at its worst reasonable combination, not its best. A component whose floor is respectable is one you can stop worrying about.
Plateaus, not peaks. A good setting is one whose neighbours are also good. A peak surrounded by cliffs is a fitted number.
Consistency through time. “Good since 2020” isn’t what I’m looking for. I want to find parameters that have held up over time.
How bad is a peak, really? Of the 50 best cells in the 2000–2020 grid, none landed in the top 5% over the 69 years of S&P 500 history I later tested. They didn’t collapse; they regressed to “somewhat above average”, which is exactly what a mined peak looks like.
The grid maps where the tested constructions behave coherently and where they do not. That is better evidence than one attractive cell. It is still development evidence wherever it influences the design; averaging the rows does not make those decisions independent of the sample.
It also pays to count independent evidence, not cells. Neighbouring cells share most of their trades, so a hundred of them from one sweep are close to one piece of evidence about one market. Different markets, eras and random draws are much closer to independent. When I say a finding held, the question is “in how many genuinely different places?”, not “in how many rows?”.
So I’m always stating similar demands. Don’t show me the best; show me a fair average, based on thousands of tests. Show me how it pans out year by year, not a headline number. And show me how safe I really am from the bear market nobody saw coming. A single backtest answers none of those.
Inside the Algo Collective. Core Collective members get two templates and a research file. Alpha members get 4 single models and 2 multi-model books with an even more extensive research file + research brief. Anyone can invest in the premium Momentum Masterclass package, which includes: a 60k research brief you can feed to your AI and ask literally everything about the project; shorter briefs; an entire course; 5 single models & 7 multi-model books. Yes, it’s the real deal. Alpha members get 35% off the Momentum Masterclass.
Writing the Rules Down First
Before the latest round ran, I wrote a plan, and I can’t tell you how important this is when using AI as a ‘quant intern’. Everything needs to be thought about: the goals and metrics; the methodology; the interpretation; the tests; and so on. This human judgement step (with or without AI), along with the discipline of deciding the pass / fail gates up front, is where you get to apply actual trading experience that the AI simply doesn’t have. This ‘friction’ is ‘the filter’ as my friend Kris Longmore recently said. It’s the kind of know-how (discernment about what really matters) that AI still can get woefully wrong.
So I fixed, in advance:
How universes would be grouped. Twenty universes behave like about five economic blocs (the Nasdaq family, the S&P family, US mid caps, Canada and Australia), so evidence was counted by bloc, and two US smaller cap universes (US small caps and the S&P 1500). Given prior experience with momentum and believing it to be a large cap phenomenon, these were kept as negative controls: places where I expected the tests to fail.
How a factor would be scored. Seven metrics (annual return, maximum drawdown, MAR, Ulcer Index, expectancy, bad-year drawdown, a smoothness score and the floor), turned into percentiles among the factors and averaged up through group and region. The methodology for analysing these models comes from the fact that I choose to classify this model under a Trend Following bucket. Again, not something the AI picks up on. I specifically wanted to be an ‘outlier hunter’ here - searching for the big wins and positive skew, not concerned with win rate or smooth equity curves. The goals determine the metrics I’m using to assess the model.
What “best everywhere” would mean. Four qualification criteria a factor had to pass, written before the data was scored.
The statistics. A bootstrap of yearly excess returns, a correction for testing 34 factors at once, and a direct estimate of the probability that picking the in-sample winner is just overfitting.
Predictions from earlier work, each with the result that would count against it.
Every one of those is a decision I could have made after seeing the data, and every one would then have been bent, without my noticing, towards whatever looked good. Writing them down first is cheap, and AI can actually help you enforce your own standards here, because once locked in, it will report on them without bias.
The Coin Toss
Before any of this was run, I wrote a question in my design notes that I couldn’t answer: “The factor is either a factor or it isn’t. If it isn’t, are we really building ‘momentum’ models, or just regime-gated, trend-requiring, low-volatility trades randomly distributed into the stock market?” My guess at the time was that the factor would help over randomness, but that a lot of the return would turn out to belong to the rising market. This was the test that answered it.
Every backtest in this series runs on scaffolding: a regime that steps aside in bear markets, equal weighting, a rotation schedule, and a sample that includes one of the strongest bull markets in history. Any of those could flatter a ranking. So this is the first real attempt to prove momentum wrong: what does the scaffolding earn on its own?
The test is almost embarrassingly simple. Change one line: rank on a random number instead of momentum, and keep everything else identical.
There’s one important trap. Draw a fresh random number every bar and the “random book” churns constantly, pays commissions on every churn and loses to costs alone. Beating that is beating a strawman.
I know because I built the strawman first. In an earlier round a random score redrawn every bar turned the book over five times faster than the real factors, destroyed the account, and made the real model look 69 standard deviations better than chance. A number like that should make you suspicious, not happy: the test was measuring commissions, not momentum.
So each stock’s random score is held between rebalances for a set number of periods, and the hold length is swept so the random book trades about as often as the real factors do. In the latest round: four hold lengths per cadence, 20 independent draws each, three matched scaffolding cells, all 20 universes. 9,600 random backtests. The question becomes fair: at matched turnover, on identical machinery, does momentum beat chance?
What the Coin Toss Earned
Here’s a selection from the results. Each figure is a median over the matched cells; annual return (ROR) and MAR (annual return divided by maximum drawdown). Remember, random and momentum tests have an advantage over buy and hold just from the market timing mechanism of staying out of bear markets.

Source: latest-round random baseline, 2000–2020, in sample. “Bank” is the median over all 34 factors; buy-and-hold is the total-return index.
Three things in that table changed how I thought about everything after it. It stands out like a sore thumb really.
The scaffolding isn’t zero. In US large caps a random five-stock book inside this framework matched or beat buy-and-hold (MAR 0.15 against 0.11 in the S&P 100, 0.16 against 0.12 in the S&P 500). Equal weight, a regime and a bull-heavy sample do that with no skill at all. So “my momentum model beat the index” isn’t evidence of momentum; “it beat a random ranking on the same machine“ is.
Momentum beat chance clearly in some places and not in others. The Nasdaq-100 and all six Australian universes cleared it by a wide margin. The S&P 100, the Russell Top 200 and the TSX 60 cleared it more modestly. And in the broad S&P 500, the S&P 500 outside its top 100, the Russell 1000 and US mid caps, the typical momentum factor lost to a random ranking. In the S&P 500, only 3% of cells beat random’s 90th percentile. (An earlier study found the same thing from another angle: on the S&P 500 only 27% of 25,800 configurations beat chance.) If there’s anything at all to momentum, I don’t know how people are seeing it in small caps. It seems to be a large cap phenomenon to me, so, please feel free to show me how you find it in small caps - I’ll be happy to learn. One caveat, remember I’m testing across 34 different factors at this point - some of them may not be sound at all.
The controls failed, as expected so I don’t think momentum is a small cap phenomenon. Small caps and the S&P 1500 came in well below random. That matters more than it looks. A test that can’t fail can’t tell you anything when it passes.
To make this really clear. Many might “test a model” and that model already contains regimes and filters that produce a nice “market timing” model (in a bull market to boot) and think that “they’ve found a momentum strategy”, but these results suggest that the timing, filtering and bear market are all they have found.
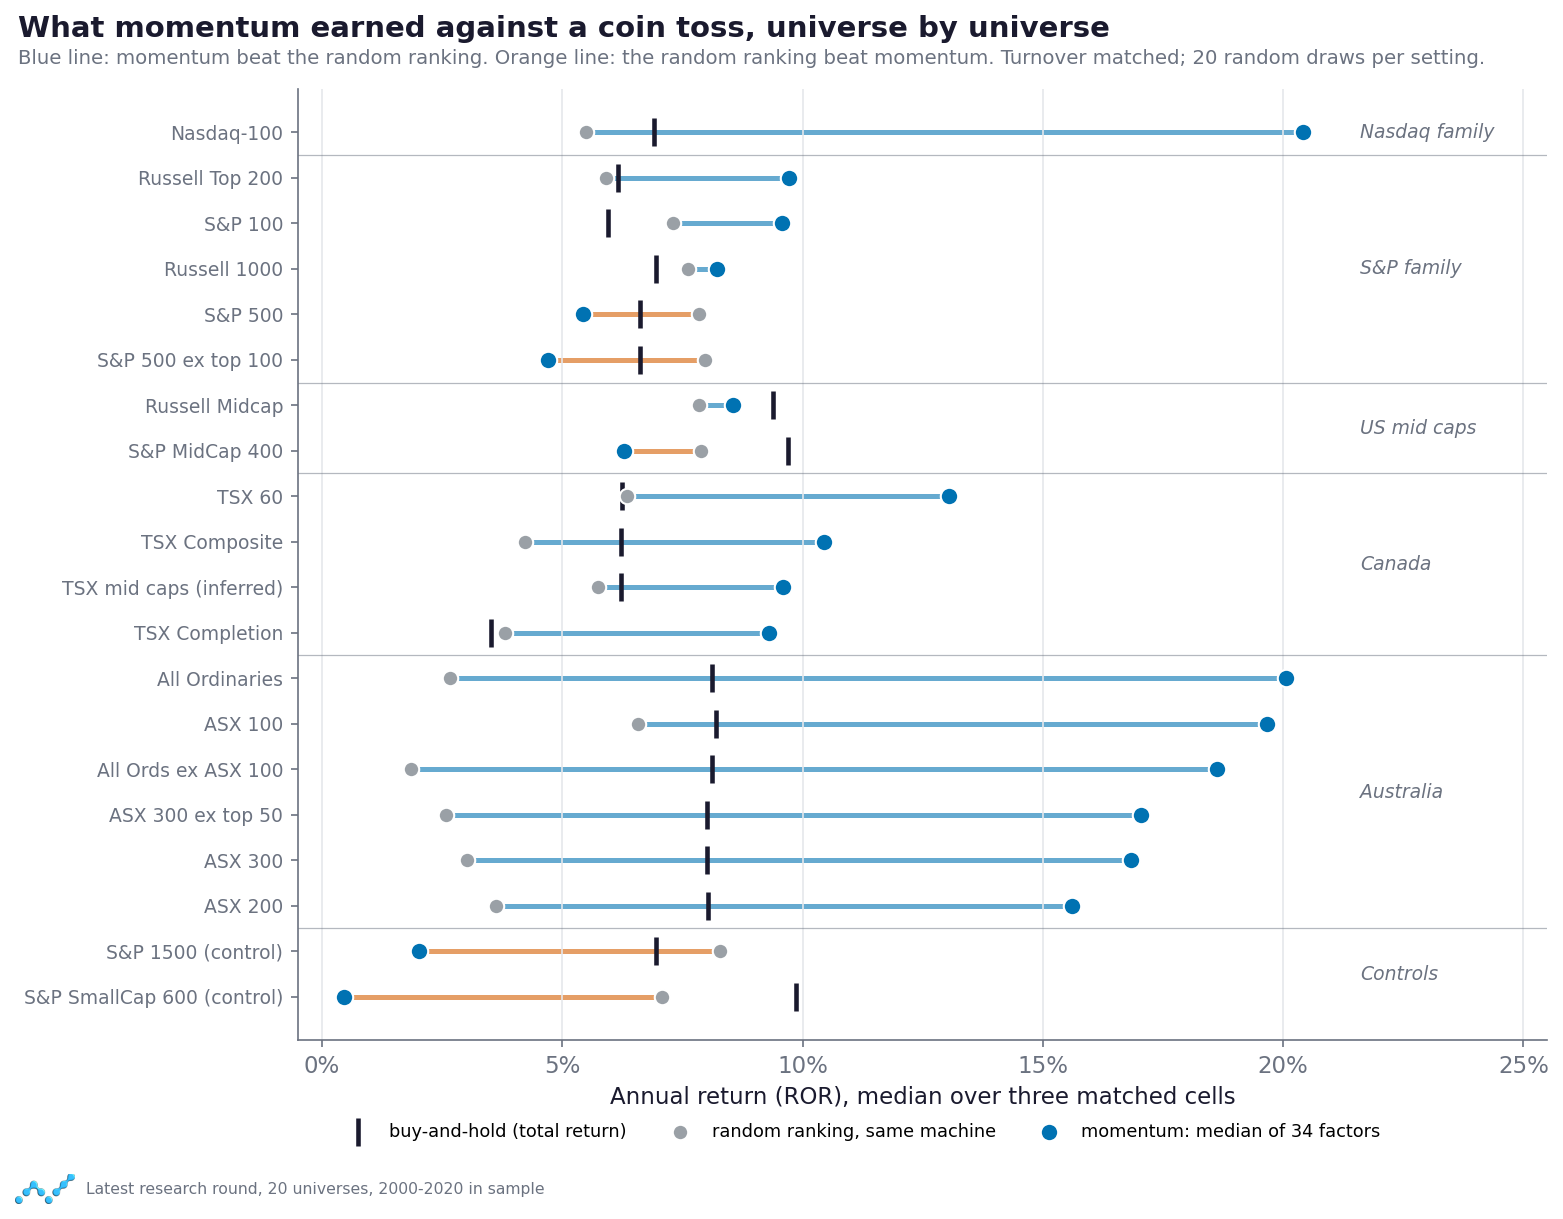
Source: latest-round random baseline, 20 universes, 2000–2020. Median over three matched cells; 20 random draws per setting, turnover matched.
A Colleague Finds the Hole
A few days later a colleague sent me a critique of random benchmarks in general, and it exposed a flaw: a random book run inside regimes and stock filters is often under-invested. In this research file a stock filter is applied after ranking. If the third-ranked name fails the filter, that slot stays in cash. And the regime only blocks new buys; it never sells. Put those together and a random book can sit with empty slots that a real factor, whose top names tend to pass the filters, fills. Less invested means smaller drawdowns, and smaller drawdowns flatter MAR.
My held-draw design had matched turnover. It hadn’t matched exposure. In the regime and filter cells the random book ran 3–20 points less invested than the factors.
So I fixed it in both arms. Filters moved before the ranking (the ranking only sees names that pass, so every slot fills), and the regime was made to sell everything when it turned off, in the real and random books alike. Random’s exposure rose from 75–84% to 99%, with turnover unchanged. Then I re-ran the comparison: 1,360 factor tests and 3,200 random ones.
The verdicts for the concentrated universes held, almost to the point. Momentum still beat random in the Nasdaq-100, the S&P 100 and the Russell Top 200 in every cell, at both cadences. The S&P 500 on weekly rotation still didn’t look as good as I’d like. On monthly rotation the S&P 500 moved from “loses” to “mixed” (+1.3 points a year with the regime selling in both arms).
Where the bias had been was the drawdown comparison. With the filter after ranking, random had looked 4–16 points better than the factors on maximum drawdown. Most of that was simply cash.
A null has to match the strategy on turnover and exposure. Matching one and not the other gives you a strawman in one direction or a ringer in the other. I’d have missed it if I hadn’t been doing the project with a partner.
The Machinery Did Most of the Work
The coin toss has a second use, and it’s the one that took the shine off a lot of my earlier “improvements”. Every bit of the gain I thought I had found had come from changing the scaffolding (regime, filters, etc), and a random ranking got it too. That is, I wasn’t finding anything new about momentum per se.
That pattern repeated through the programme. Almost every headline improvement came from the machinery, not from the selection. This is just an open invite to over-fitting. The rule I took from it: re-run the null on every candidate configuration, not once at the start, and credit an improvement to the factor only if the gap between factor and random grows.
The coin toss also answered a question I’d been avoiding: what does the factor actually buy you? The answer, across all three countries, was a yes to return, but a no to safety.
In two weekly US mega-cap models, swapping the factor for a held random score (50 draws at each of six hold lengths) cost 15 to 28 points of return a year, and the real factor beat all 300 of its random runs on return and on Sharpe. That’s about as clear a win for selection as you’ll see.
Yet both factor models drew down deeper than many of the random runs, consistent with the factor picking more volatile names. And in the seven bad years in the sample, each beat the random median only three times.
In Australia, in sample, the factor added three to five points a year over chance, the most stable number in that study, while its maximum drawdown sat in the middle of the random distribution or worse. It was picking harder-falling names.
Canada was the exception: there a two-model book beat all 60 random draws on drawdown too, with a construction that sold everything when the regime turned off. When I tried that construction on a US monthly model, it didn’t reproduce the effect: selection beat random on return in every cell and on drawdown in none.
So, as a working rule: expect the factor to supply the return, and the machinery (regime, exits, position count, sizing) to supply any protection. A better factor is unlikely to give you a smaller drawdown. This is the first hard piece of evidence for something I said near the start of the series: momentum’s ranking is a way of concentrating into what’s leading a rising market. It certainly isn’t a defence.
The Claim I Wrote Down, and How It Fared
In the questions post I published a short list of claims for this round, each with a pass condition written before the data that would judge it. The first one was this:
The ranking carries information, not just the scaffolding. Pass: the real factor beats a random ranking, at matched turnover, on return in at least 4 of the 5 market blocs. Fail would mean: the edge is the regime and the bull market, not the selection.
By its letter, it didn’t pass. The Nasdaq family, Canada and Australia cleared it. The S&P family split down the middle (the S&P 100 and Russell Top 200 beat random; the broad S&P 500 and the S&P 500 outside its top 100 didn’t), and so did US mid caps. Three clear, two split.
What a fail was supposed to mean, “the edge is the scaffolding”, turned out to be true in some universes and false in others. In the broad US large-cap universes, over this window, ranking on momentum added little or nothing that a random pick on the same machine didn’t. In the concentrated mega-cap universes it added a great deal.
I think that’s the most useful result in the whole programme, precisely because it’s inconvenient. This is how trading research goes - it brings you to some tough decisions that require some judgement. The question now is: “Are you comfortable with the idea that a factor only works in certain markets, or does it’s failure to apply more globally mean it isn’t real?”. This is the age old debate between “fitting to certain markets” and the main point for now is that, over time, you have to shape what is acceptable to you as a trader, and build accordingly.
For me, the business decision (any business involves getting paid to take risk) was to narrow the project. From here, the US work concentrates on the US mega-caps, where the ranking demonstrably earns its keep. The broad S&P 500 comes back later in the series with a longer history and a more complicated story (deciding to take actions to diversify, irrespective of backtest results).
Where You Trade Beats What You Rank By
One more reading of the grid, because it sets up everything that follows.
Average the gap between momentum and the random ranking across all 34 factors, and look at it by universe group. In the Australian groups the gap is about +0.21 to +0.28 of MAR. In the concentrated US mega caps and Canadian large caps, about +0.10 to +0.12. In the broad US large caps and US mid caps, slightly negative.
The spread between universes is far larger than the spread between factors within one. An earlier first-pass study (27 factors across 18 universes) put a number on it: the universe explained about 68% of the variance in MAR, the factor about 5%. For Sharpe it was 76% against 6%. And a factor’s MAR ranking in one universe barely predicted its ranking in another (an average rank correlation of 0.13).
The share of configurations that beat chance tells the same story from another angle. In an earlier weekly study of 25,800 configurations, the proportion that beat a matched random ranking was 96% on the Nasdaq-100, 65% on the S&P 100, 34% on the Russell 1000, and 27% on the S&P 500. On a broad universe the typical configuration is noise.
I’ll be honest: this is the result I liked least in the whole programme. I’d hoped for momentum as a general factor, a property of how people trade stocks anywhere. The grid says something closer to “momentum is a property of certain universes”, a weaker and more fragile thing to build on. Which factor you pick still matters, but where you trade explained far more of the result than what you ranked by. The next question writes itself: what is it about the Nasdaq-100 that momentum likes, and about the broad market that it doesn’t? If I can find a reason for the edge being concentrated, I’ll be happy to continue.
Robust by Design: The Null, Done Properly
Change one line. Replace the score with a random number; leave everything else identical.
Hold the draw. Keep each stock’s random score for several rebalances, and sweep the hold length so the random book’s turnover brackets your strategy’s.
Match exposure too. If filters or regimes leave slots in cash, the random book will look safer than it is. Filter before ranking, and give both arms the same regime behaviour.
Draw many times. One random run is an anecdote. Twenty or thirty give you a distribution, and your strategy’s percentile within it.
Keep negative controls. Run universes where the effect shouldn’t work. If they pass, your test is broken.
Judge on return first. A random book that sits in cash will win on drawdown for the wrong reason.
Write the pass condition down before the run, and publish the result when it doesn’t pass.
Try it in the research file (members). The random factor isn’t in the bank, and building it is the exercise. Add a factor that draws a random number and holds it for HoldN rebalances, then run it beside your chosen factor on the same universe, regime and gate. Sweep HoldN until its trade count brackets yours, use 20 draws per setting (a dummy parameter swept 1–20 gives fresh randomness on each run), and read your factor’s percentile against the draws. Then move one gate before the ranking and see how much of random’s drawdown advantage disappears.
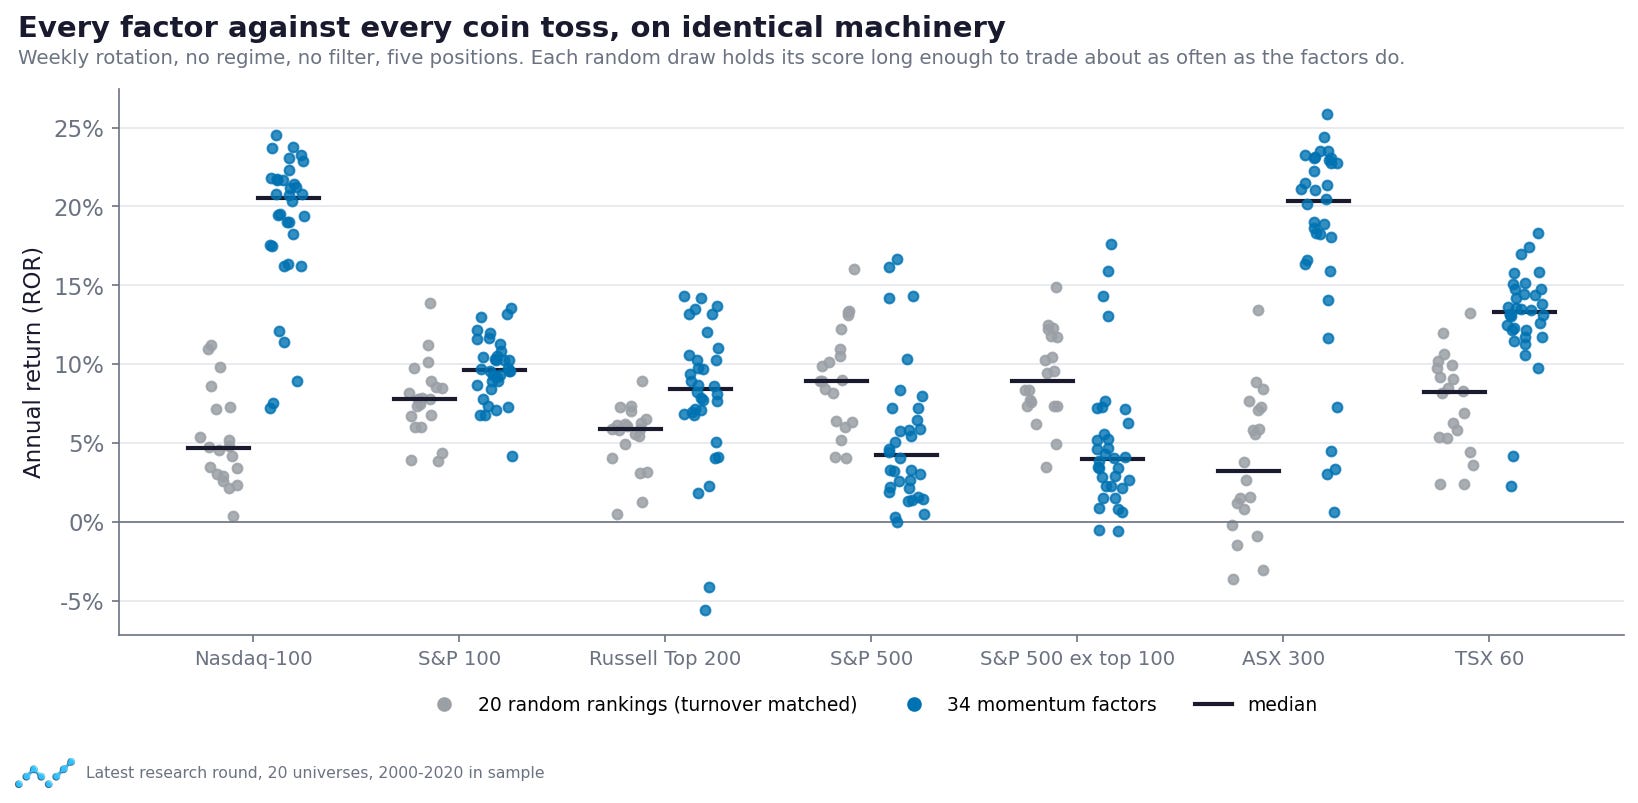
Source: latest round, weekly rotation, no regime, no filter, five positions, 2000–2020.
Key Takeaways
If you’re reading carefully, you’ll be getting ideas of further tests and a desire to probe assumptions. I can’t present months and months of momentum work in a single series, so don’t read it as conclusive, read it as a foundation to setting up your own lab.
Read distributions, then account for selection. Main effects, paired comparisons and weak cases are useful; choosing a family from them still uses the history.
Twenty universes are about five markets. Count your evidence honestly.
Write the rules down before the run, and date every change you make after it.
Build the null before you believe the result. A random ranking on the same machine earned as much as buy-and-hold in US large caps.
Match the null on turnover and exposure. A colleague caught my under-invested random book; the verdicts held, but the drawdown comparisons had flattered random.
Momentum beat chance in concentrated and international universes, and lost to it in the broad US market over this window. My first registered claim didn’t pass as written, and the project is better for it.
Most “improvements” are machinery. Re-run the null on every new configuration; a random book often improves just as much.
The factor buys return, not protection. Defence has to come from somewhere else.
Where you trade explains far more than what you rank by: about 68% of the variance against 5%.
Coming up: where momentum actually lives. A cap ladder, three countries, a universe where buying the strongest names was the fastest way to lose money, and the prediction from the questions post (strong beats weak, in a sensible decay) put to the test. One number on that report refuses to decay at all.
Inside the Algo Collective: two templates and a research file at Core; four single models and two multi-model books at Alpha; and everything, including the 60k research brief, multiple flagship models and the full course, in the Momentum Masterclass (35% off for Alpha members). We’ll work through the research together as the series runs.
To your success,
Simon
These are my own research artefacts and wild opinions. You might find a way to use them to investigate the market and inform your own trading, just remember it’s not advice of any kind. Full disclaimer: https://algoadvantage.io/disclaimer
Hi Simon ,
Another wonderful learning curve for me , Momentum has never been of interest but this series has made it a worth while read , the combo of your RealTest Chat GPT and the super quick , Claude Code has done the trick . Looking to smash down that DD , to something wearable , has been a good pathway to visit .
cheers michael b
The matched random ranking becomes much more informative once turnover and exposure are both controlled. The under-invested null’s drawdown advantage is a useful reminder that a control can look safer for the wrong reason.