

I spent longer deciding what would make me believe momentum is real than I spent testing momentum models. That ‘research first’ philosophy is what makes the models almost obvious by the time I build them.

Part 1 was survival first: start slow, start boring, and treat the early years as skill acquisition rather than a race to 100% a year. This part is the bridge from that idea into the actual research.
The subject is relative momentum: rank a universe of stocks by how strongly they’ve risen, hold the strongest, and rotate as the ranking changes. It suits a part-time trader almost perfectly. It rebalances weekly or monthly, it needs no screen time, and it’s been studied for decades. Which is exactly why I didn’t want to take it on trust. A lot of eyes have been on this for a long time. Is there any alpha left?
The deep research is coming. Forgive me one more post of groundwork first, because being scientific about R&D starts before any testing, with how you frame the questions. Ask the right ones, and decide in advance what each answer will be allowed to mean. That matters even more with AI in the loop (see my course): it will answer whatever you ask, quickly and confidently, so the quality of the question is most of the game. The whole process is really about getting out of the way of your own biases, and staying sceptical until the weight of evidence leaves you no choice.
The Wrong First Question
“Far better an approximate answer to the right question, which is often vague, than an exact answer to the wrong question, which can always be made precise.”
John Tukey wrote that in 1962, and every quant researcher should have it taped to the monitor.
Institutional quants do research, new traders ‘build models’. They frequently show themselves ‘evidence’ of something, while I’m shaking my head thinking ‘you’ve not only asked the wrong question, there are faulty assumptions, a lack of data points for significance, and a failure to consider we are dealing with human behaviour in an unknown future, not a physical law’. I appreciate that’s harsh, I want to rip the band-aid / bandage / (what do you call it?) off.
As an example, almost everyone building trading strategies starts in the same place: I’ve got an idea. Is it robust?
That’s the second question.
It quietly assumes there’s something there. It assumes the effect you’re about to spend six months on exists at all, in the market you picked, at the timeframe you picked, in the form you happened to imagine it. And the moment you’ve built the model, you stop researching. You start advocating. Every test from that point onward is a test you’re hoping will pass, run by someone who already knows what they want the answer to be.
I’ve watched people do this for years. I’ve done it myself, at length, expensively.
So with the momentum work I inverted it. Before writing a line of code, I wrote down the questions. Then I built a machine to answer them, and ran close to half a million back-tests across 20 universes in three countries to give momentum every reasonable chance to fail. I ran another half a million after that.
What survived that reconnaissance became the research file I’m handing over with this series: 20 universes and 34 ways of measuring momentum, every one switchable. The early studies ran on a very similar, slightly smaller set, so I’ll show you their results as we go. Strategy code will also be provided in the Collective.
This series is that programme, in order. This post is the part everyone skips.
The Gun-Jumping Problem
Look at how model-first research actually unfolds.
You have an idea. You build it. It looks decent. Now you want to know if it’s robust, so you run the usual battery: out-of-sample, walk-forward, Monte Carlo, a couple of other markets. Some of it passes. Some of it doesn’t, and you adjust. Round and round, until the thing survives everything you’ve thought to throw at it.
Here’s the problem. Every one of those adjustments was made against the data you were testing on. You didn’t validate a model. You fitted one, slowly, using robustness tests as your loss function. It’s the most respectable-looking way to overfit ever invented, and it’s what most “system development” actually is. In fact, David Baily and Marcos Lopez de Prado (2014) introduced a statistical correction tool called the Deflated Sharpe Ratio to account for this kind of over-fitting. The DSR basically deflates your Sharpe in proportion to how many tests you used to get to your final output.
The alternative is reconnaissance before commitment. Go wide first. Generate a great deal of data about the space rather than about one idea in it. Find out where the effect lives, where it dies, how it decays, what it needs to work. Be genuinely honest in the lab, where being wrong is free. It’s like spending weeks preparing to build a garden: test the soil, research the climate and what grows best there, know the methods for pest control and so on. This is all just ‘research’, you haven’t started ‘building’ yet.
I’m researching, not building a model.
Yes, I know how “a million back-tests” sounds. It sounds like data snooping, hunting for the diamond in the rough. It’s the opposite. I want so much data that only effects which keep reappearing, across paths, trades, filters, exits and markets, can rise to the top. I wasn’t testing a model, I was running every factor I could dream of, over every universe I had access to, in 1000 different ways, to see whether momentum was real or not, simply that. Searching for a winner and measuring a distribution are different activities, and a future post is entirely about the difference. Defining ‘real’ of course, is stating up-front what will convince me, and what won’t.
A backtest refutes. It very rarely confirms. That asymmetry should shape everything about how you use one.
One practical note, and I mean this sincerely. Writing the plan down, ready to talk about it publicly here, did more for my framing than any amount of additional testing. It’s uncomfortable. It’s also the cheapest quality control available. An hour of it will change what your results are allowed to mean. Please try it.
I call this approach robust by design. By the time I build a model, I’ve covered so much ground in research that I already know which nuances matter and which don’t. The steps change for every project and every model type, and the only constant is to test till you throw up, because that’s what it takes when edges are small and competition is fierce. So the process is less a checklist than a way of thinking.
And that starts with the questions you ask, and how you decide what counts as a valid answer.
The Questions I Actually Wrote Down
Here they are, grouped the way I used them in the momentum project. Lift them straight onto your own idea; almost none of them are momentum-specific.
Existence. Does this factor work at all (I literally trust no one)? Across different universes, geographies and markets? From large caps down to small? Does strong momentum genuinely beat weak momentum, or am I looking at a lucky slice? Does it beat the market? Does it beat random?
That last one sounds flippant. It isn’t. It became one of the most confronting results in the entire programme, and it gets its own post.
Measurement. How many ways are there to measure momentum? Rate of change, skip-month returns, regression slopes, volatility-adjusted returns, distance from highs, and so on. If I test all of them and they broadly agree, what does that agreement actually buy me? And if some fail completely while others thrive, what does that tell me? Note: I’ll share the majority of the 34 momentum factors I built (across 5 families) as we go.
The first of those got an early, humbling answer. In the reconnaissance sweep I correlated the year-by-year results of 27 momentum measures across 18 universes. Twenty-one of them fell into a single cluster, with a typical correlation of about 0.8 between any two members. In sample results below.
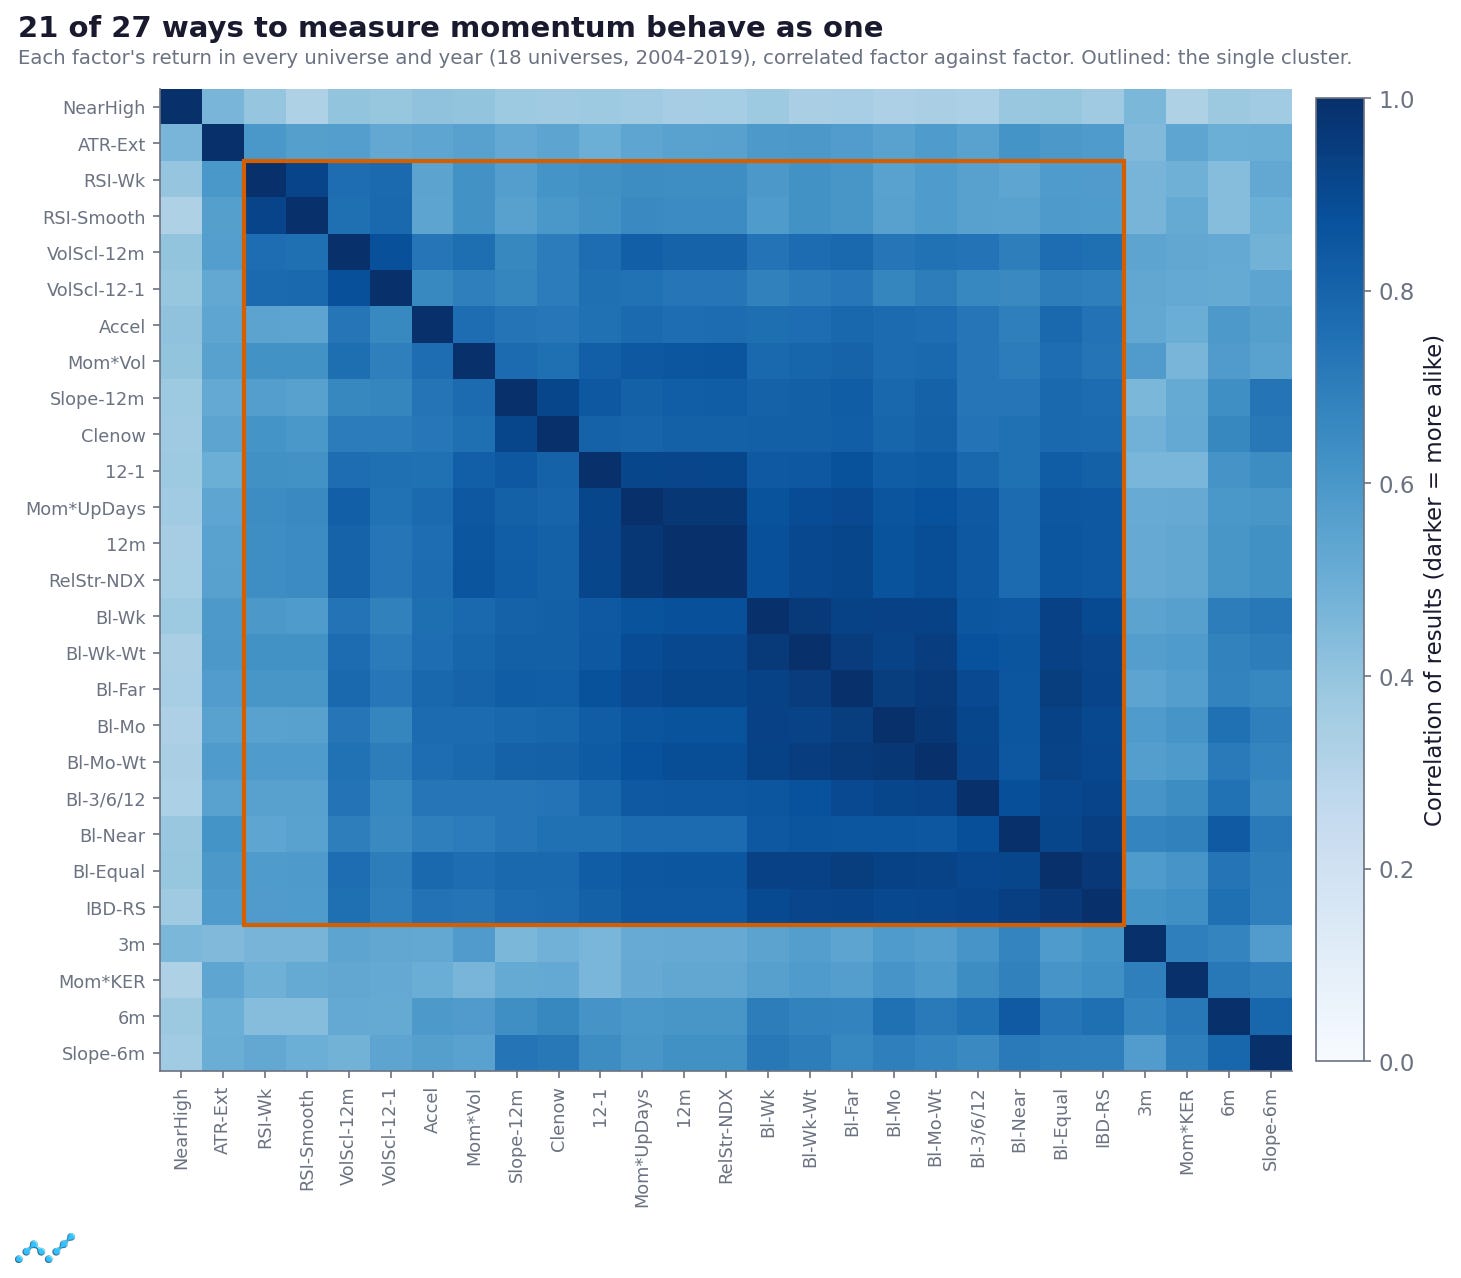
Source: the first-pass factor sweep, 27 factors × 18 universes, in-sample 2004–2019. Correlations are of each factor’s calendar-year return in every universe. Norgate data using RealTest.
So most ways of measuring momentum are one measurement taken many times. Broad agreement between them is reassuring about the effect, and tells you almost nothing about which one to use. That question gets its own post. Still, I’m suspicious - momentum is already correlated to the market, so, I do expect broad correlation.
Goal. Relative momentum shares its objective with trend following: capture the outliers and keep positive skew. That single sentence decides the metrics. Is MAR (annual return divided by maximum drawdown) enough, or do expectancy and average win size matter more, given what this strategy is for? And the metrics decide which factor wins. In a future post I’ll show you two perfectly reasonable metrics ranking the same fifteen candidates in almost opposite orders. Decide this before you test, not after you’ve seen which answer flatters you. I knew up-front (and sure, experience counts) that a bumpy ride would probably pay off out of sample more than anything finely tuned, because fine tuning would be to reduce expectancy, payoff, positive skew. These are my guardrails in real life non-ergodic markets!
Mechanism. What behavioural or structural phenomenon am I exploiting, and why should it persist? Who is on the other side, and why do they keep paying? My working hypothesis was the textbook one: investors underreact to news and then pile in late, and large institutions can only move their positions slowly, so trends in individual stocks persist longer than they should. The counterparty is whoever sells a strong stock too early and buys it back too late. If I can’t name the mechanism and the counterparty, I don’t have an edge.
Data. Where is the best data, and how do I carve it into in-sample and out-of-sample? What are valid start dates given when index constituency actually begins (SPX, the S&P 500, from 1958; NDX, the Nasdaq-100, only from 1994)? Is it survivorship-free and point-in-time? If not, none of the rest counts, and I’d rather find that out now than in month five. It would be a total beginner-error to test a strategy “on the NDX constituents” prior to 1994. Not that your back-testing engine would inform you of the error.
A sneak peek at another amateur mistake: the typical liquidity filter. Something like price above $5 and a million shares a day means one thing today and something very different twenty years ago, when prices and volumes were lower. Applied across the whole history, it quietly deletes much of the early universe, and your backtest is now skewed toward the present. Then, let’s not even talk about a realistic view of commissions back through history - further back-test impact that is usually unaccounted for. All of this “data stuff” really counts.
Regime. What’s the role of bull, bear, range-bound, high-volatility and low-volatility markets? When do the large drawdowns and the large wins actually arrive? I want to see decades that look nothing like this one, which means going back to the 1950s, not to 2010. I appreciate that momentum portfolios are largely concentrated bets on equities - so when risk-off events occur, correlations go to one. I want to ‘begin with the end in mind’ (the end is building a ‘multi-model book’, not just one) and consider whether different variants behave differently under stress, and I know regime handling will be key to this. Will I need ‘fast acting’ and ‘slow acting’ variants to better manage unknown future crises? Generally, this ‘ensemble approach’ is my default, so I’m planning on it from the start.
Portfolio. What are the diversifiers? Does running several models genuinely diversify, or does it just spread one bet thinner? Which components make two models actually different: universe, factor, regime, exit, sizing, rebalance cadence? Nearly every model I’ve ever deployed has been part of a multi-model book, because a single model with a single set of locked parameters doesn’t carry much significance. I want maximum simplicity and robustness at the model level, and smoothing at the book level. Having that goal at the outset changes what I need to measure from the very first test.
Risk. What are the worst cases I’m seeing, and can I prepare for them even when my chosen backtests happen to hide them? What are correlations during severe risk-off events, rather than on average? Averages are where risk goes to hide.
Now notice what isn’t on that list.
Not one of those questions is what parameters should I use.
Momentum Isn’t Pure Trend Following, and That Changes the Test
Same objective as trend following. A completely different test.
This is the point about process I most want to land, and it generalises far beyond momentum: each model type demands its own research process. Not its own parameters. Its own process.
With trend following you have a price event to test. A breakout is a thing that happens, on a bar, to a symbol. You can run it across every stock in a universe and count what happened afterwards, every instance, in every market. Mean reversion patterns are the same.
Relative momentum has no such thing. There’s no entry pattern. Nothing triggers. The entire concept is buy the strongest names, which is a ranking, not a signal. You don’t test whether a pattern works, because there is no pattern. You test whether an ordering carries information.
That distinction has enormous consequences for how I’m allowed to test. The principles carry across strategy types; the test design can’t.
Here’s the falsifiable prediction I wrote down before running anything:
If momentum is a real factor, the top five ranked names should outperform the next five, which should outperform the five after that, in a sensible decay all the way down the ranking. No decay, no factor.
Then I built exactly that. Cut the universe into bands of five by momentum rank. Trade each band as its own separate portfolio. Walk down the ranking and watch what happens to the edge. The first version ran in all 19 universes of the reconnaissance, across three countries, with one standard momentum measure held fixed so that nothing moved except the rank.
It decays.
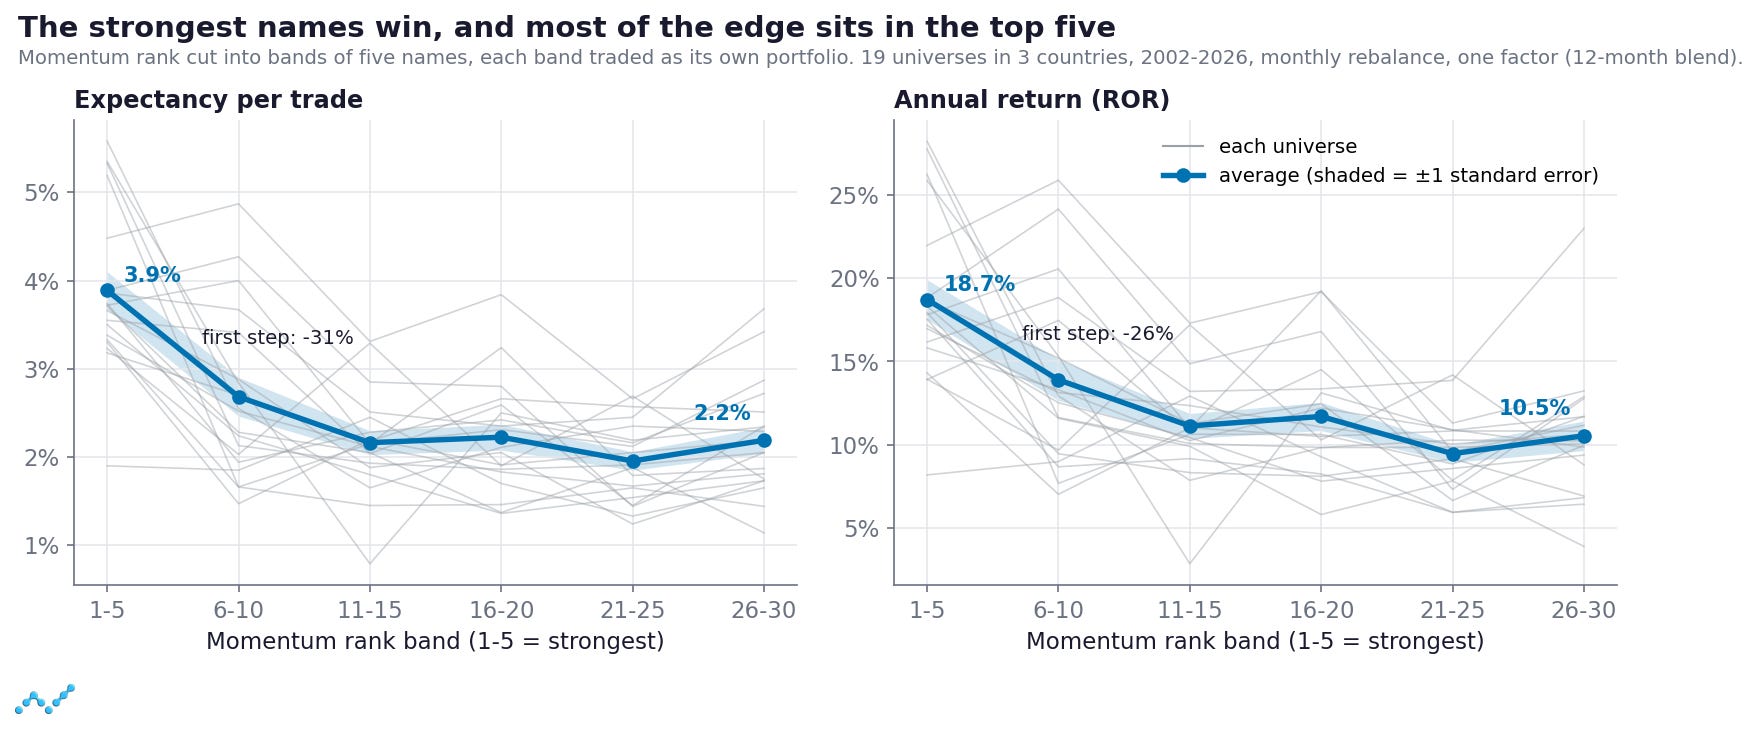
Source: the first-pass rank-band study, 12-month momentum blend, 19 universes, 2002–2026, monthly rebalance. Grey lines are individual universes; blue is the average.
Expectancy per trade falls in all 19 universes, and annual return falls in 18. The top five names average 18.7% a year; ranks 26–30 average 10.5%.
Not the way I expected, though. Look at the first step. Moving from ranks 1–5 to ranks 6–10 costs about a quarter of the return and nearly a third of the expectancy, and below rank 15 the bands are hard to tell apart. It’s less a slope than a cliff at the top. And one number on that report doesn’t decay at all. That changed how I judge every factor since, and I’ll come back to it later in the series.
Members can run the same tests across 34 factors and 20+ universes with the Script I provide. Apart from the impact on how many positions you want to hold, we are continuing to assess so many factors across so many universes, certain items are going to continue floating to the top. Anything that doesn’t generalise, I’m going to throw out. This means my final models will underperform (in the back-test), compared to an over-optimised model, but it makes me a damn site more confident about what happens after deployment.
The point for now is smaller and more portable: the shape of your test should be dictated by the shape of your edge. Get that wrong and you can run ten thousand back-tests that are all, technically, answering a question nobody asked.
What Would Make Me Walk Away
Questions are worthless unless you also write down what failure looks like. Otherwise every result is a pass, because there’s always a reading in which it’s a pass. In case you’re missing it, I’m spelling out the scientific method here.
The first commitment was the broadest one. Momentum is constantly applied to the Nasdaq-100. Every momentum model you see online seems to live there. So I asked the obvious, unwelcome question: if it works only on the Nasdaq, is momentum the factor, or is NDX the factor? If a genuine market phenomenon can’t show itself across multiple universes, multiple countries and multiple ways of measuring it, given half a million chances, then it isn’t a phenomenon. It’s a location. Partially, that’s ok, ‘tech stocks go up, buy tech’, but I want to know if the momentum factor is really a return-driver in its own right.
So breadth was the kill criterion, declared up front: if strong momentum doesn’t beat weak momentum outside the Nasdaq, in more than one country, there’s no project.
Thankfully, it didn’t fire.
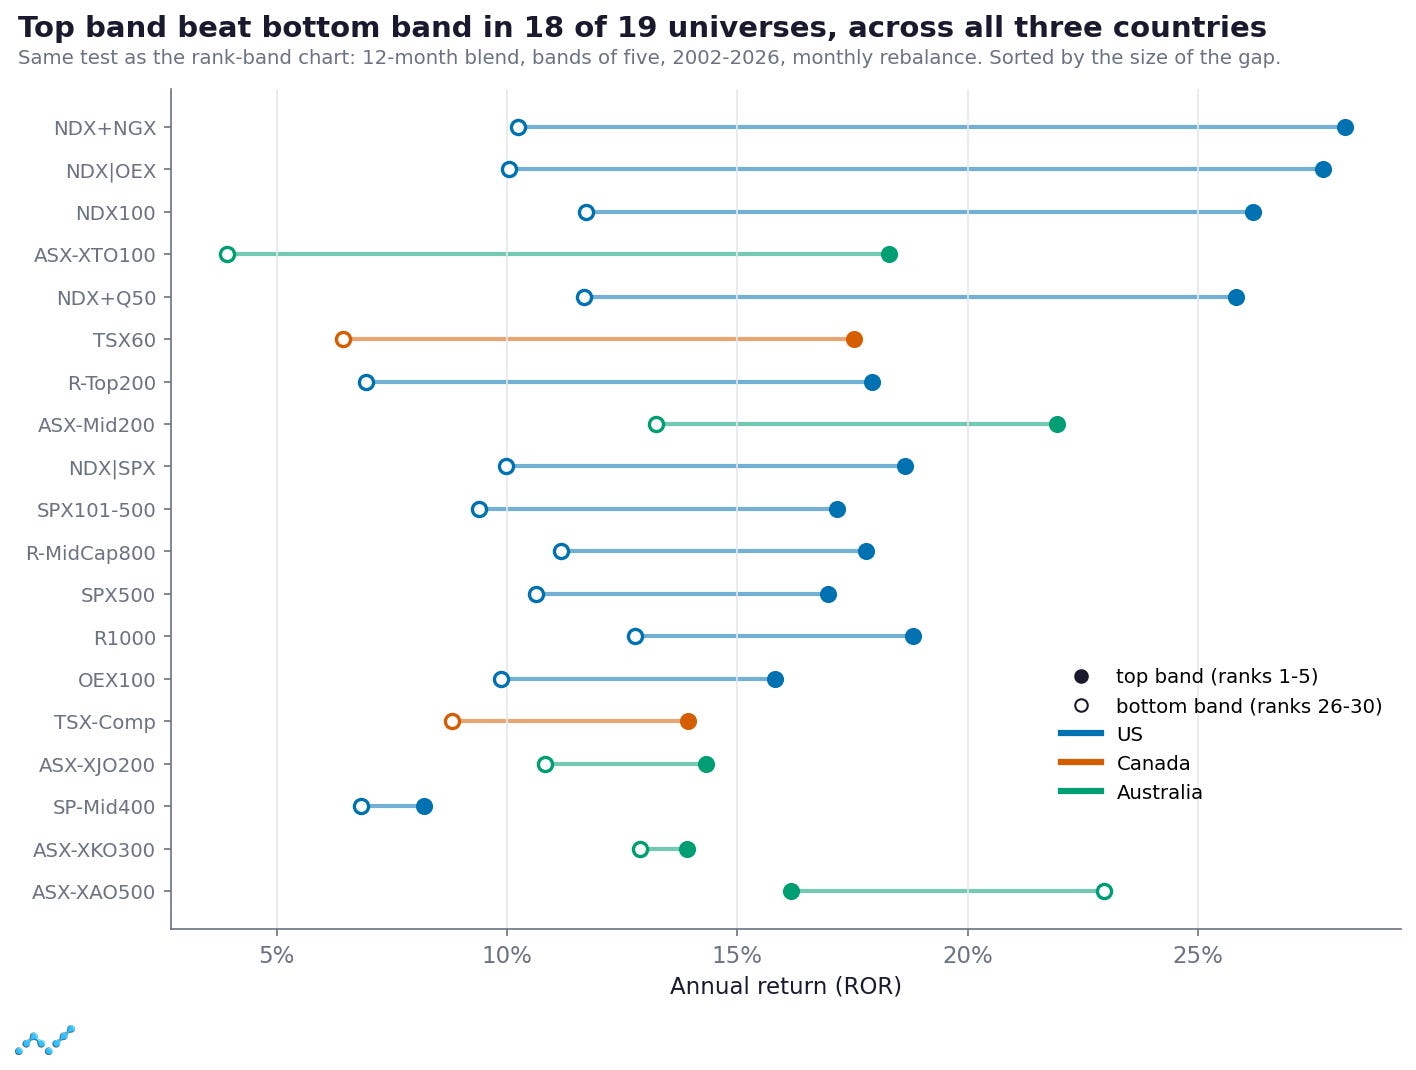
Source: the same rank-band study. Filled dot: the five strongest names. Open dot: ranks 26–30.
The top band beat the bottom band in 18 of 19 universes: US mega caps, US mid caps, Canada, Australia. The one exception is the broadest Australian universe, the All Ordinaries, and why momentum turns upside down in a universe full of small, speculative names is a story for a later post. Passing this test only earns the right to keep going. Whether the ranking beats a random ranking is a much harder question, and I’ll take it on in a future post.
After that, every belief I was carrying in got written down as a claim with a pass condition, before the data that would judge it was opened. Here’s one from the last round, lifted from the real programme:

I’d have bet the house on that one. A future post opens the envelope.
This research repeats, and each round the questions get sharper. Here’s a short list going into the current round, on the final research file, written before the sweep that will judge it. Where a condition says “market blocs”, it means the five broad groups the 20 universes fall into: the Nasdaq family, the S&P family, US mid caps, Canada and Australia.
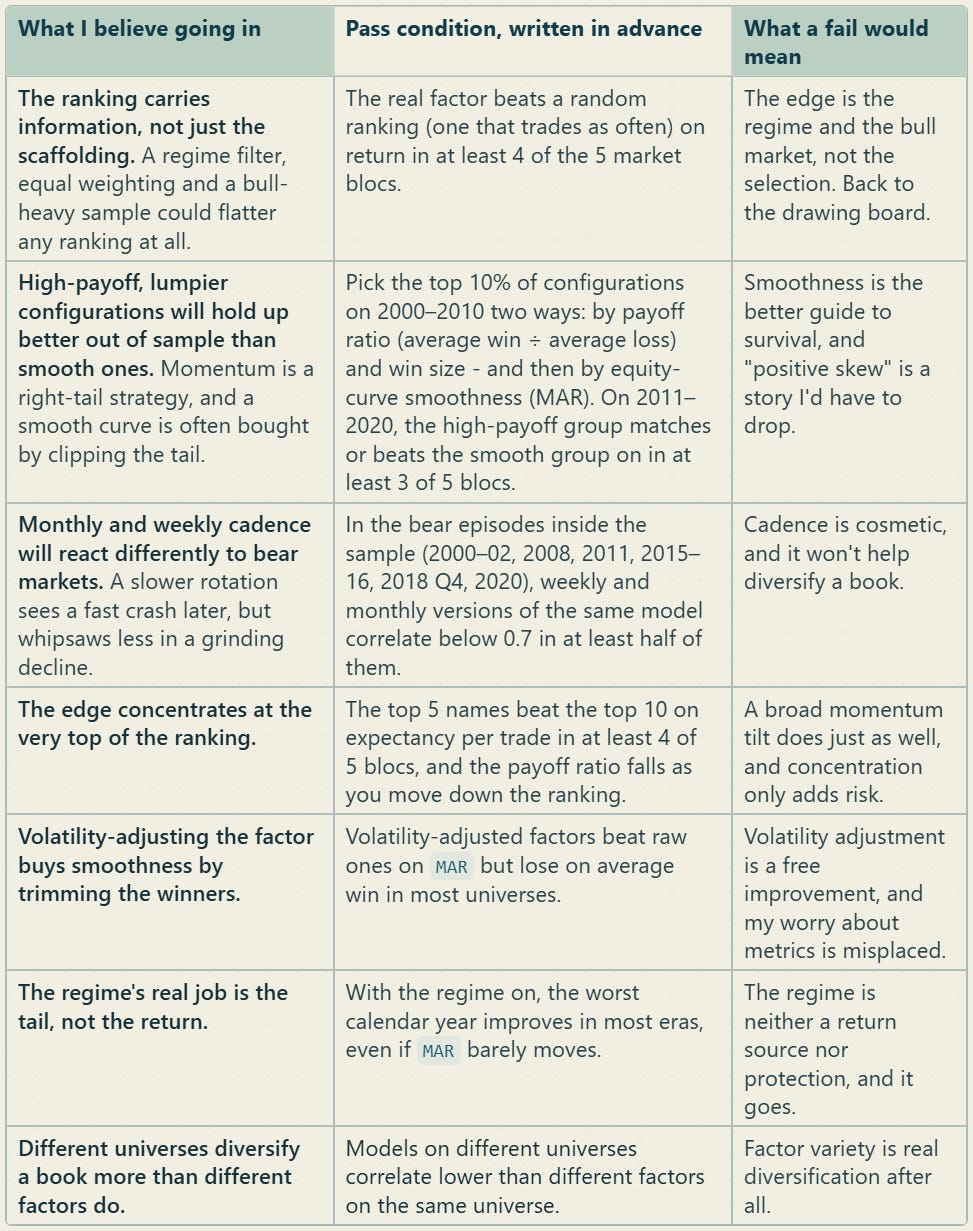
Some of these I already lean towards; others are genuinely open. That’s deliberate. A list where you expect everything to pass isn’t a test, it’s a wish list. I’ll report which held and which didn’t as the series goes on.
Where the Science Stops
I want to be honest about the limits here, because the confident version of this argument is a lie, I’m pretty sure of that.
Justification is codifiable: once you’ve found something, there are rigorous ways to test it. Discovery is only constrainable: no procedure hands you the idea, but a good one stops you from fooling yourself about it. Extrapolation is a bet: whatever survived the past still has to meet a future that hasn’t happened yet.
A strict process cannot guarantee that a strategy works. Nothing can. What it can do is guarantee three things, and they’re worth more than they sound: you know roughly how often you’d be fooled by chance, because you built the null to measure it; every degree of freedom is accounted for; and failures get detected while they’re still survivable.
That’s the scientific content of this work. Everything past it is managed uncertainty. Trading is still a business, still an entrepreneurial endeavour, and still requires taking risk, because no one can actually see into the future.
Physics will tell you precisely what a ball does when you drop it in a vacuum. Markets aren’t a vacuum. There’s weather, and the weather blows the ball off course every single time, and no amount of rigour makes the weather predictable. Which is why the process has to stay iterative, why experience keeps counting, and why the metrics you look at will change as you move between strategy types, markets and timeframes.
What stays constant is the accounting. Statistical significance, market knowledge, risk management, portfolio construction and your own goals, merged into one framework for deciding what you’re allowed to believe.
The scientific part of this work isn’t the model. It’s the accounting.
Key Takeaways
Write the plan before you write the model. It takes an hour and it changes what your answers are permitted to mean.
Ask whether the effect exists before you ask whether your version of it is robust. Reconnaissance first, commitment second.
Name the mechanism and the counterparty, or you risk fitting noise rather than finding an edge.
Derive your metrics from your goal. If the job is capturing outliers, expectancy and average win outrank win rate or whatever ratio your software prints at the top of the report.
Every model type demands its own test design. Momentum is a ranking, so the test has to be a ranking test.
Write down what would make you abandon the idea entirely, before you run anything. Then honour it, in public, when it fires. Ouch!
Coming up: before touching any data, why momentum should exist at all, who’s on the other side of the trade, and why they haven’t stopped paying. Then the machine itself. Twenty universes across three countries, thirty-four ways of measuring momentum, twenty market regimes, forty-three filters, and the argument that running half a million back-tests is the opposite of overfitting, provided you use it right.
That last clause is doing an enormous amount of work, and I’ll show you exactly why.
After the momentum work, we’ll bring mean reversion into the portfolio, and you’ll see why that matters more than any second momentum model could.
The research file (all 20 universes, all 34 factors, every regime and filter), the full component code and the survivorship-free universe builds go to members, and we’ll be working through this live in the Collective as the series runs. I’m not the final authority on any of it. Collectively we’ll find better answers than I will alone.
To your success,
Simon
A note on language: This is my strategy research rather than as ‘a strategy’. Do what you will with it. These are research artefacts you’d use to investigate the market and inform your own trading, not advice of any kind. Apparently I’m not allowed to give advice. Full disclaimer: https://algoadvantage.io/disclaimer
The section on relative momentum as a ranking, rather than a price-trigger pattern, made the test-design point very concrete. Writing the walk-away condition before running the next test is a useful safeguard.
The part I'd like to hear more about is what stays untouched after that first broad sweep. You mention writing pass conditions before opening the next set of data. How do you separate those stages when the initial research has already taught you where to look?